Document a system architecture in Confluence
Build an architecture page that shows how your services connect, how a request flows through them, and how the system fits into its surroundings.
Problem: Architecture diagrams live in drawing tools and go stale. Nobody redraws the boxes when a service is added, so the page soon shows a system that no longer exists.
Solution: Write each diagram as Mermaid code in a Mermaid Diagram macro. A change is a one-line edit that anyone who can edit the page can make.
What you'll need
- Mermaid Diagrams Macro for Confluence, installed on your site. See Get started.
- Permission to edit the page.
Set it up
1. Draw the services
-
Open the page, select Edit, and type
/mermaidwhere the diagram should go. -
In the macro, select Create diagram, then Start from a snippet > Architecture with Icons > Insert.
-
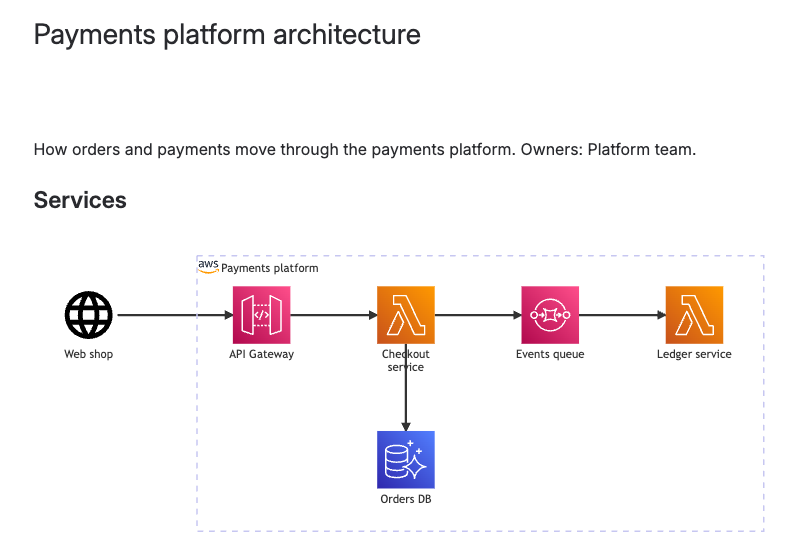
Replace the services with your own. Each
serviceline is one box, andgroupdraws a frame around boxes that belong together:architecture-betagroup cloud(logos:aws)[Payments platform]service gateway(logos:aws-api-gateway)[API Gateway] in cloudservice checkout(logos:aws-lambda)[Checkout service] in cloudservice db(logos:aws-aurora)[Orders DB] in cloudservice web(mdi:web)[Web shop]web:R --> L:gatewaygateway:R --> L:checkoutcheckout:B --> T:dbIcons come from two built-in sets:
logos:for cloud and technology logos, andmdi:for general icons such asmdi:serverormdi:database. Find names at icones.js.org. An unknown name shows a question mark. -
Under Display size, select Large, then select Save and close.
2. Show how a request flows
- Add a second macro under a heading such as "Order flow".
- Select Create diagram > Start from a snippet > Sequence Diagram: API Flow > Insert, and change the participants and messages to your own.
- To keep a simpler overview next to it, select Add diagram > Blank diagram and write a short flowchart. Readers page through the two diagrams with the arrows next to 1 of 2.
- Select Save and close.
3. Place the system in context
- Add a third macro and insert the C4 Context Diagram snippet.
- Name the people and outside systems your platform works with, then select Save and close.
- Publish the page.
Check that it works
- Open the published page as a reader would.
- Hover over a diagram and select Open full screen. Zoom in on a dense area to check that labels are readable.
- Ask a teammate to change one label with Edit diagram. The change shows for everyone as soon as they save.
Keep each diagram to one idea. A page with three focused diagrams is easier to read and to update than one diagram with 60 boxes.
Related
- Supported diagram types: architecture, C4, block and the other types you can use.
- Keep several diagrams in one macro or panel: tabs, order and the reader's pager.
- Have an AI assistant create pages: describe the system and get the whole page, diagrams included.